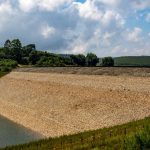
A settlement reading of 8 mm means little without a location, reference point and time interval. Spread uniformly beneath a long road embankment, that movement may have different implications from 8 mm concentrated at a bridge approach over a few days. Start with the failure mode of concern: differential settlement, lateral displacement, heave or movement along a deeper slip surface.
Define the movement before choosing instruments
Ground movement can affect transport infrastructure directly or through its supports. Differential settlement may distort pavement or a railway formation; lateral movement can load a retaining wall or displace a bridge foundation; heave may reduce clearance or damage a slab. The monitoring plan needs to identify the asset, the ground volume likely to move, the direction of concern and the period over which change would matter.
Build a conceptual ground model before placing instruments. Boreholes, construction records, groundwater observations and previous defects help distinguish compressible fill from soft natural deposits or an active slope. Include points where movement is expected and stable reference points outside the suspected zone. If a reference point moves, even precise readings can give a false picture.
Movement is not the same as damage. Gradual, uniform displacement may be tolerable, while a smaller differential movement near a bearing, joint or track transition may need attention. Readings must be assessed alongside inspections and the asset’s structural response.
Match measurements to the ground mechanism
No single instrument describes an entire moving soil mass. Choose measurements according to the question: Is the surface deforming? Is movement occurring at depth? Could changing pore-water pressure be involved?
- Levelling and survey targets track elevation or position at selected points. Repeated surveys can show patterns along an embankment or approach if benchmarks and methods remain consistent.
- GNSS receivers provide repeated three-dimensional positions at accessible surface locations. Installation stability, satellite visibility and the required precision govern their usefulness.
- Inclinometers measure lateral displacement profiles in a borehole. Successive profiles can show whether movement is distributed through fill or concentrated at depth.
- Extensometers and settlement systems measure relative movement between selected depths or across a particular zone, helping distinguish surface change from compression below it.
- Piezometers measure groundwater pressure, not displacement. Paired with movement readings, they can help test whether pressure changes coincide with acceleration.
- Remote sensing, including radar-based satellite measurements where conditions permit, can show broad surface trends. Findings still need checking against site observations and stable reference areas.
Coverage comes with trade-offs. A borehole instrument gives depth-specific evidence at one location; a surface survey covers more points but may not identify the moving layer. Remote sensing can guide investigation along a corridor, though vegetation, geometry, surface changes and measurement direction can leave gaps. In built-up corridors, take care to distinguish ground movement from movement of structures used as targets; monitoring urban ground movement for transport infrastructure examines that problem in more detail.
Make the baseline defensible
The first reading is not necessarily a baseline. Construction activity, recent rainfall, groundwater recovery or seasonal temperature changes may already be affecting the site. Where possible, collect pre-event observations, record installation conditions and use consistent procedures for repeat measurements.
Give each monitoring point an identifier, coordinates, an elevation datum, an installation depth where relevant, and a record of repairs or replacement. For surveys, document the benchmark network and uncertainty. For automated instruments, keep raw measurements alongside processed values: a changed software correction or filter can otherwise look like ground movement. Photographs and dated condition notes can help explain jumps after resurfacing, excavation or disturbance of an instrument head.
Compare measurement uncertainty with the change that matters. A fluctuation close to an instrument’s repeatability is weak evidence of acceleration. A stable surface marker, meanwhile, cannot rule out movement developing at depth. Independent measurements, such as survey points above an inclinometer, give the results a useful cross-check.
Set frequency and triggers around response time
Reading intervals depend on how quickly a plausible mechanism could become hazardous—and how long verification and action would take. Slow consolidation may be followed with periodic surveys. Suspected rapid slope movement or an active excavation may call for more frequent or automated readings. Rainfall, groundwater change, adjacent works or new defects may warrant a temporary increase in frequency.
Triggers should separate readings that need checking from conditions that require an operational response. They may use displacement, movement rate, acceleration or differential movement between nearby points. Set values for the ground and asset in question; a universal millimetre threshold ignores geometry, uncertainty and consequences.
- Check the reading. Confirm instrument identity, time stamp and reference stability, then check whether the change exceeds measurement uncertainty.
- Compare independent evidence. Review neighbouring points, rainfall and groundwater records, recent work and visible defects.
- Assess the asset consequence. Check whether deformation affects track geometry, pavement serviceability, retaining elements, bearings or clearances.
- Escalate through a pre-agreed procedure. Assign responsibility for engineering review, closer inspection and any necessary operating restrictions or intervention.
One exceedance could be a sensor fault; repeated acceleration across several instruments is harder to dismiss. Visible distress also calls for assessment when the monitoring array shows no change: it may not cover the mechanism at work.
Interpret trends without losing the field context
Plot readings against time and mark construction phases, intense rainfall, drainage changes and instrument maintenance. Cumulative displacement can hide a recent rise in rate; a rate plot can exaggerate noisy readings. Use both views, with uncertainty and sampling intervals visible.
Suppose a surface marker on an embankment settles while a deep extensometer remains stable. Compression may be occurring above the extensometer’s lower anchor, but the inference depends on the anchors’ positions relative to the soil layers. If nearby survey markers settle by different amounts, that differential pattern may matter more to serviceability than the largest individual reading. The next field check should verify the survey benchmark and inspect the pavement or track where the measured change is steepest.