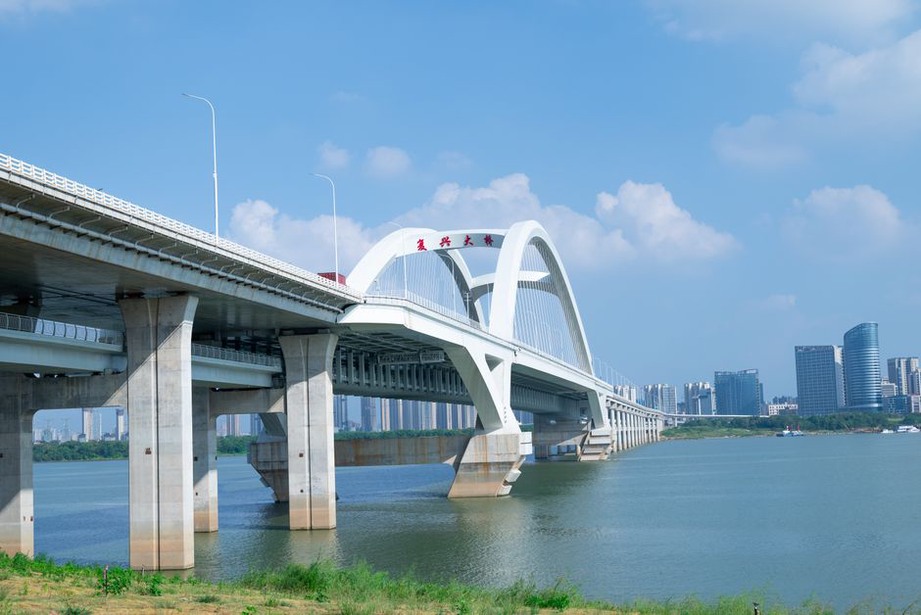
A bridge bearing may show steadily increasing displacement without being close to failure. Temperature, traffic and instrument drift can all affect the reading. A useful prediction system must separate those effects well enough to inform a decision: for example, is displacement likely to cross an inspection trigger before the next scheduled visit? A reading that merely looks unusual is not enough.
Predictive analytics in transport infrastructure uses past measurements, together with operating and environmental data, to estimate a future condition or the likelihood of a specified event. Unlike a dashboard, it looks beyond current readings; unlike a fixed-limit alarm, it estimates what may happen next. The output might be a range of expected track settlement, an estimate of when drainage-related movement could reach a trigger, or the likelihood that a sensor pattern warrants investigation. It cannot, by itself, establish the cause of deterioration.
Start with the decision, not the model
The first choice is what to predict. “Predict bridge failure” is seldom a workable objective: failures are rare, their mechanisms vary, and records may contain few comparable examples. “Estimate whether measured movement will cross a review threshold before the next inspection” can be tested. That threshold and interval must come from the asset’s engineering assessment and operating procedures, not from a value chosen to improve model performance.
Specify the asset and location, target measurement, forecast horizon, update frequency, acceptable false-alert rate and lead time needed to act. Name the action a forecast could prompt: check a sensor, review recent work, arrange an inspection or carry out a more detailed assessment. The evidence needed for a low-cost data check is different from the evidence needed for a decision that disrupts service.
Whether a condition can be forecast depends on its mechanism. Slow settlement or progressive deterioration may leave a measurable precursor. Sudden scour during an exceptional flood, or damage from an impact, may not. For those hazards, observations of the event or forecasts of the hazard may be more useful than extrapolating an asset-condition trend. State which mechanisms the system is intended to detect—and which it is not.
Build a record that represents the asset
Sensor streams, periodic surveys, inspections, maintenance records and external conditions rarely arrive in a common format. Their timestamps, locations and meanings must be reconciled before modelling. A rail geometry measurement assigned to a chainage interval does not describe exactly the same point as a settlement sensor several metres away. An inspection grade for an entire bridge span may likewise be too coarse to label a local strain response.
Keep each measurement’s unit, sampling method, sensor position, calibration history and known periods of poor quality. Record changes in traffic, drainage, loading, nearby construction and instrumentation. Repairs and sensor replacements matter especially: a step change after either intervention should not be learned automatically as natural recovery or deterioration.
- Condition evidence: inspections, defect dimensions, geometry surveys, crack or joint measurements, and verified maintenance findings.
- Response evidence: displacement, strain, acceleration, pore pressure, tilt or vibration, alongside the operating conditions during measurement.
- Context: temperature, rainfall, water level, traffic or train loading, ground conditions and documented changes to the asset.
- Data-quality evidence: missing intervals, communication faults, calibration checks, sensor replacements and suspected drift.
Context is not merely noise to remove. Seasonal moisture and temperature changes can alter road foundation support, making a recurring environmental response look like deterioration. The physical pathways are discussed in how climate conditions affect road foundation support. Weather data help only if they represent conditions at the monitored location; a distant rainfall gauge, for instance, may poorly represent a culvert catchment.
Missing data can carry information
Do not fill every gap. A communications outage during a storm may remove the observations most relevant to a slope or drainage problem. Short gaps can sometimes be estimated for descriptive work, but forecasts should retain flags distinguishing observed values from imputed ones. A long gap, an implausible jump or a flat-lined sensor may warrant withholding a forecast until the instrument is checked.
Choose methods to match the mechanism and evidence
No model family suits every asset. A simple seasonal baseline may predict routine movement more dependably than a complex model trained on a short record. Regression and time-series methods can estimate trends and environmental effects when the data are consistent. Change-point methods can identify a shift after a storm, excavation or repair. Anomaly detection finds unfamiliar patterns, but does not diagnose them: a revised train timetable can produce unfamiliar signals too.
When failure records are sparse, survival or reliability methods may be useful if inspection histories give defensible information about when deterioration became observable. Physics-informed methods can constrain predictions through known relationships among loads, temperature, ground response and structural behaviour. Another option is to model departures from a physical baseline, rather than ask a statistical model to learn the entire response from scratch.
Choose input features with the same care. Rolling rates, accumulated rainfall and temperature-adjusted displacement may reflect meaningful processes. Hundreds of automatically generated features may instead capture coincidences at one site. A signal correlated with later defects is not predictive if it was recorded only after crews had noticed the problem. This data leakage can make retrospective results look impressive while providing no usable warning in operation.
Test forecasts as they would be used
Randomly splitting individual sensor readings between training and test sets can overstate accuracy because adjacent readings are often nearly identical. A more credible test trains on an earlier period and forecasts a later, untouched one. If the system is intended for multiple sites, testing on held-out assets helps expose dependence on the original location. Neither test is easy: exposure, construction details and maintenance practices vary.
Judge accuracy against the decision. If exceedances are rare, a model that always predicts “no exceedance” may appear accurate while missing every event of concern. Report misses, false alerts, warning time and uncertainty at the chosen horizon. Compare results with persistence, a seasonal trend or an existing engineering trigger. Extra complexity has little operational value unless it improves the decision.
| Evaluation question | Why it matters |
|---|---|
| How often are consequential events missed? | Misses can delay inspection or temporary controls. |
| How many false alerts occur per asset and period? | Excess alerts can overwhelm inspection capacity. |
| Is there enough lead time to act? | An accurate forecast arriving after a usable intervention window has limited value. |
| Do stated prediction ranges contain later observations? | Unreliable uncertainty estimates encourage overconfident decisions. |
| Does performance persist across seasons and assets? | Environmental cycles and site differences can defeat an apparently strong model. |
Check event labels as carefully as sensor data. The date a defect enters an inspection system is usually its discovery date, not its onset. Judging a model against that date can distort its apparent warning time. Record the interval in which the change could have occurred and, where possible, check labels against raw readings, photographs and work orders.
Turn a forecast into a controlled workflow
Deliver a forecast with the observations behind it, its time horizon, an uncertainty range and any data-quality concerns. The recipient should be able to tell whether rising estimated risk reflects faster measured movement, recent rain, a changed baseline or reduced confidence because data are missing. An unexplained score is easy to accept uncritically—or to ignore.
Keep verification separate from engineering judgment:
- Check data integrity, sensor status and recent changes in measurement or operation.
- Compare the forecast with independent evidence, such as another instrument, a survey or a targeted visual inspection.
- Assess plausible mechanisms and the consequences of waiting until the next observation.
- Follow the asset owner’s established review and operational procedures; record who made the decision and the evidence used.
- Add the verified finding to the record, including cases where an alert proved false.
An embankment settlement forecast, for example, might justify an earlier geometry survey—not an assumption that the formation has failed. If the survey confirms movement, investigation can examine its distribution, drainage and recent works before a remedial approach is considered. The model directs attention; it does not replace diagnosis.
Keep the system credible after deployment
Performance can change with the asset, sensors or operating conditions. Monitor input distributions and forecast errors, and set review conditions such as sensor relocation, major repair, prolonged outage, changed loading or repeated observations outside stated prediction ranges. Retraining needs versioned data and documented labels so the revised model can be compared with its predecessor.
Keep forecasts as originally issued, not just the latest recalculated result. Inspectors may need to establish what was known when an alert appeared and how later work changed its interpretation. Recording forecasts during a period of parallel operation, before they affect decisions, can reveal alert rates and workflow problems. Human review remains essential when a missed event could have serious consequences or the model encounters conditions absent from its training record.
A bounded example: settlement at a rail transition
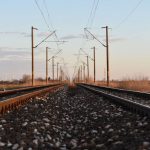
Suppose periodic track surveys and a continuous displacement sensor cover the transition between an embankment and a rigid structure. The question is whether measured geometry is likely to reach an established review trigger before the next planned survey. Historical surveys define the target; sensor readings, temperature, rainfall and maintenance dates provide context. A time-ordered test compares predictions with later surveys across wet and dry periods. If the system indicates a higher likelihood after heavy rain, staff first verify sensor stability and check the latest geometry. Confirmed movement prompts assessment of the transition and supporting ground. An unconfirmed alert stays in the record as evidence of false-alert behaviour.
For that example, the next fields to standardise are the date and chainage of every survey and intervention. Without both, a later model update cannot reliably separate movement recorded before maintenance from measurements taken afterward.