Settlement becomes an infrastructure problem when it is differential rather than uniform. A building, pavement, utility corridor, retaining wall, or rail alignment may tolerate limited overall lowering. Changes in level over short distances, however, can cause cracking, lost drainage gradients, track geometry defects, joint distress, and overstress in buried pipes. Monitoring must therefore establish not just how far the ground has moved, but where, when, and how quickly movement is occurring.
Urban sites make this difficult. Variable fill, old foundations, leaking utilities, dewatering, tunnelling, nearby excavations, seasonal groundwater fluctuations, traffic loading, and redevelopment may all be influencing the ground at once. Sound interpretation depends on measured data, a defensible ground model, and an accurate record of construction activity.
What settlement monitoring needs to measure
Ground settlement is the downward vertical displacement of the ground surface or a subsurface stratum relative to a defined reference. It can result from consolidation in compressible soil, ground loss into voids or leaking pipes, densification of loose fill, groundwater drawdown, decomposition of organic material, or stress redistribution around excavations and tunnelling works.
A useful monitoring programme distinguishes between several related measures:
- Cumulative settlement: total vertical movement since the baseline reading.
- Differential settlement: the difference in movement between nearby points, often the measure most closely associated with damage.
- Settlement gradient: the change in settlement over distance, which can reveal localized deformation.
- Rate of settlement: movement over time, used to identify whether behaviour is accelerating or stabilizing.
- Angular distortion: relative rotation between points supporting a structure, assessed together with structural observations.
Vertical displacement alone is seldom enough. Lateral movement, groundwater levels, pore-water pressure, excavation depth, support loads, and the timing of grouting or dewatering may explain a settlement trend. The parameters selected should reflect the hazard mechanism, rather than simply the instruments available.
Establishing a dependable reference framework
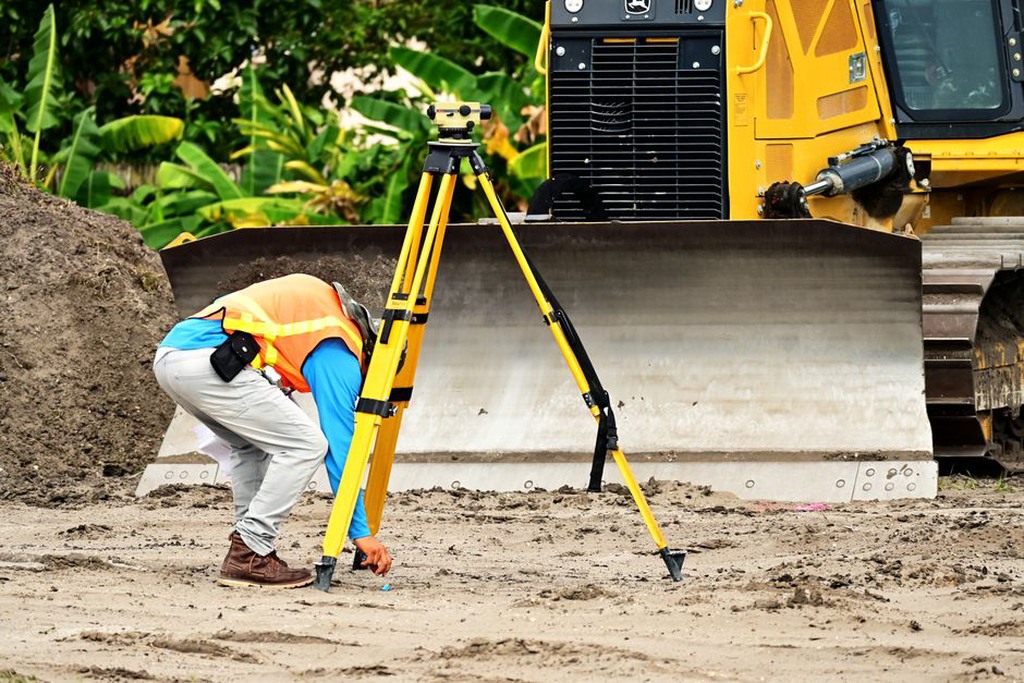
Every settlement value is only as credible as its reference datum. Reference benchmarks need to be located where they are unlikely to move because of the works or the wider regional process affecting the site. They should be checked against independent stable points, protected from accidental disturbance, and surveyed using a method with precision appropriate to the expected movement.
In dense urban areas, presumed stability needs to be verified. A benchmark attached to an old masonry wall may itself be moving, while a point outside an excavation may still lie within its zone of influence. Redundant benchmarks and repeated closure checks can expose instability in the reference network. Survey records should identify datum changes, instrument calibration, relevant weather constraints, and any interruption to the observation period.
Baseline observations are not a formality
A baseline should capture normal variation before disruptive works begin. Readings taken on different days may reveal survey scatter, temperature-related movement in structures, traffic vibration effects, or seasonal groundwater response. For existing assets, the baseline survey should also record pre-existing cracks, distortion, drainage defects, and utility condition. Without that evidence, attributing later damage becomes much less reliable.
Monitoring methods and where each is useful
No single technique captures every settlement mechanism. In most cases, several complementary methods provide better evidence than extensive use of one sensor type.
| Method | Primary observation | Typical strengths | Main limitations |
|---|---|---|---|
| Precise levelling | Surface elevation at discrete points | High vertical accuracy and transparent repeatability | Labour-intensive; coverage is limited by point spacing |
| Total station monitoring | Three-dimensional movement of prisms or targets | Frequent automated readings possible; useful around excavations | Requires line of sight and stable instrument control |
| GNSS | Three-dimensional position | Useful for broader-area movement and open sites | Performance is constrained by urban canyon effects and vertical precision needs |
| InSAR | Broad-area surface deformation | Identifies spatial patterns and historic trends over large areas | Needs specialist processing and ground validation; coherence can be poor |
| Settlement plates and extensometers | Movement at ground surface or depth | Separates compression of soil layers from surface effects | Installation and survival require careful planning |
| Inclinometers | Subsurface lateral displacement | Detects wall, slope, or ground deformation profiles | Does not directly measure vertical settlement |
| Piezometers | Groundwater level or pore pressure | Connects deformation to hydraulic changes | Requires geological context and careful installation |
Satellite interferometry is particularly useful for screening districts affected by broad, slow subsidence. It does not replace site instrumentation when decisions concern a specific excavation, utility crossing, or rail asset. Its line-of-sight measurement, revisit interval, and processing assumptions must be understood before it is treated as evidence of vertical settlement.
For transport corridors, surface level monitoring should be coordinated with asset-specific measurements. On railways, track geometry data, sleeper support condition, drainage performance, and local ground levels can indicate whether deformation is affecting safe operation. The relationship between these observations is addressed in Railway Track Foundation Stability: Ground, Drainage and Monitoring.
Designing the monitoring layout around the mechanism
Instrument locations should reflect predicted deformation zones, vulnerable receptors, geological boundaries, and uncertainty in the ground model. Evenly spaced points may suit regional subsidence. Localized hazards need closer coverage at interfaces such as excavation edges, transitions between fill and natural ground, utility crossings, tunnel portals, bridge approaches, and boundaries between shallow and deep foundations.
Subsurface instruments are important when surface measurements cannot distinguish cause. Near an excavation beside a historic building, settlement markers may show downward movement, while extensometers can indicate whether deformation is concentrated in made ground, a compressible clay layer, or deeper strata. Piezometers can then help determine whether drawdown is contributing to consolidation. This distinction matters because each mechanism may call for a different engineering response.
Frequency should follow the rate of change
Monitoring intervals should increase during higher-risk stages: initial excavation, installation or removal of support, changes to groundwater control, tunnelling breakthrough, heavy loading near an excavation edge, and major rainfall events. A monthly survey may describe a slow background trend yet miss a rapid movement episode during construction. At the other extreme, high-frequency automated data can introduce noise that obscures the trend unless it is reviewed under clear quality-control rules.
A practical schedule links each observation interval to the expected mechanism and the time available to act. The programme should identify who reviews incoming data, who validates anomalous readings, and who has authority to request further surveys or place construction on hold while results are assessed.
Data quality: separating movement from error
Apparent settlement may result from damaged targets, poor prism visibility, thermal expansion of mounting brackets, changed instrument setup, benchmark movement, transcription errors, or altered processing settings. Automated systems have their own failure modes: communication loss, power failure, target obstruction, and algorithmic filtering all need to be visible in the data record.
Quality assurance should include repeat observations, independent checks at critical points, survey closures, field notes, and plausibility tests. One unexpected reading is a reason to verify the result, not proof of ground failure. Verification must still be prompt enough that genuine accelerating movement is not written off as noise.
Time-series plots should show raw and validated readings, the baseline, cumulative displacement, rate, and relevant work events. Spatial contour plots can reveal settlement bowls or localized troughs, but interpolation should not conceal sparse data or suggest precision between widely separated points. Reports should state measurement uncertainty and whether apparent changes exceed it.
Thresholds, trigger levels, and response planning
Trigger values should be set by the project’s competent designers and asset owners using predicted behaviour, receptor sensitivity, construction methods, observational data, and applicable requirements. A universal millimetre threshold is unreliable: acceptable movement can differ substantially between flexible pavement, an ageing masonry façade, a pressurized pipeline, and railway track.
A tiered response framework is usually more useful than a single alarm value. Typical levels may distinguish normal behaviour, increased observation with engineering review, and immediate protective action. Triggers may be based on cumulative displacement, settlement gradient, rate or acceleration, lateral movement, groundwater response, or a combination of these indicators.
- Verify: inspect the target, repeat the measurement, and check the reference control.
- Assess: compare the validated trend with predictions, construction records, groundwater data, and condition inspections.
- Control: adjust or pause the relevant activity only under the authority and procedures established for the works.
- Communicate: issue a traceable record to designers, contractors, asset operators, and affected stakeholders.
- Re-baseline only with justification: do not remove an inconvenient trend by changing the datum or reporting period.
Physical inspections remain essential. New cracking, sticking doors, ponding, displaced kerbs, changes in rail geometry, or distressed utility chambers may support the measurements. They may also reveal a problem where instruments are too widely spaced.
Interpreting patterns rather than isolated numbers
The shape and timing of settlement often provide more information than the maximum reading. A broad, gradual bowl developing alongside sustained groundwater decline suggests a different mechanism from a sharp local depression that appears after a utility leak or void formation. A trend that levels off after excavation support is installed may indicate stabilizing behaviour. Renewed acceleration after a change in dewatering requires prompt engineering assessment.
Construction logs are therefore part of the monitoring system. Record excavation stages, support installation, pumping rates, grouting, deliveries, unusual vibration, rainfall, utility incidents, and changes in sequencing. Aligning these events with displacement and pore-pressure records can reveal correlations, while recognising that correlation alone does not establish causation.
For a localized concern beside a buried utility, a useful final field check is a short precise-level line extending beyond the suspected influence area, with repeated control observations at both ends and inspection of nearby chambers and surface drainage. This targeted survey can establish whether an apparent low point is a genuine settlement trough, a shifting reference, or an isolated damaged marker before corrective work is selected.