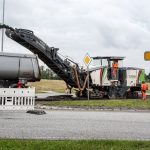
Road pavement may appear sound while the support system beneath it is losing stiffness, retaining excess moisture, or separating at layer interfaces. Core samples and trial pits remain necessary to calibrate findings and confirm materials, but they provide only sparse, locally disruptive evidence. Non-destructive testing (NDT) extends the investigation along continuous road lengths, helping engineers identify variability, target intrusive checks, and separate surface distress from structural or subgrade-related problems.
For road assets, NDT is not a single instrument and it does not replace engineering judgment. It combines measurements used to infer layer thickness, load response, internal anomalies, surface geometry, and subsurface conditions without materially damaging the pavement. The reliability of those inferences depends on calibration, survey design, moisture conditions, traffic management, and comparison with verified ground truth.
What road NDT needs to establish
A useful investigation starts with the decision that must be made, not with a preferred device. The same visible cracking can arise from an aging asphalt binder, inadequate base support, poor drainage, repeated overloading, or reflected joints and cracks from below. Each mechanism requires different evidence.
- Network screening identifies sections that need closer assessment across long road lengths.
- Project-level diagnosis establishes the likely depth, extent, and severity of a defect before rehabilitation design.
- Construction quality assurance checks layer uniformity, compaction-related indicators, and thickness trends.
- Condition monitoring tracks changes in defects or weak zones over time.
The main engineering task is to combine datasets rather than interpret a single response in isolation. A low deflection bowl, for example, does not prove that every structural layer is sound. It may mask a thin but stiff bound layer over a moisture-sensitive formation. Similarly, a radar reflection can indicate a material or moisture change, but it cannot by itself establish bearing capacity.
Surface-based methods: mapping what is visible and measurable
Visual surveys and digital imaging
Structured visual inspection remains the first stage of pavement assessment. Inspectors record crack type, raveling, potholes, patching, rutting, bleeding, edge deterioration, drainage defects, and the location of joints or utility cuts. Crack patterns matter: fatigue cracking often forms interconnected polygons in wheel paths, whereas longitudinal cracking may indicate a joint, construction seam, shrinkage, or differential settlement.
High-resolution imagery, vehicle-mounted cameras, and machine-vision workflows can make inspections more repeatable at network scale. Laser or stereo imaging can quantify crack dimensions and surface texture, while georeferenced images support comparison between survey cycles. Automated classifications still need checking against representative manual observations, particularly where shadows, repairs, road markings, debris, or wet surfaces affect detection.
Laser profilometry and inertial measurement
Road profilers use laser sensors and inertial reference systems to measure longitudinal profile and, depending on the equipment, transverse shape. Typical outputs include roughness indicators, rut depth, crossfall, and local deformation. These measurements help identify ride-quality deterioration and locations where altered grade or crossfall may allow water to pond.
Profile data describe geometry rather than the cause of deformation. A developing rut may result from asphalt shear deformation, densification in unbound layers, subgrade consolidation, or several mechanisms acting together. Profile results should therefore be assessed alongside deflection, layer-thickness, drainage, and traffic-loading evidence.
Deflection testing: assessing structural response under load
Deflection testing estimates the response of a pavement system to a known load. It is one of the most established methods for flexible pavement assessment and can also support evaluation of jointed or continuously reinforced concrete pavements when interpreted appropriately.
Falling weight deflectometer
A falling weight deflectometer (FWD) applies an impulse load through a circular plate and records deflection at the load centre and at sensors positioned farther away. The resulting deflection basin provides more information than the maximum deflection alone. The central response is strongly influenced by upper pavement layers, while the outer basin is more sensitive to support from the subbase and subgrade.
Backcalculation is commonly used to estimate effective layer stiffnesses that reproduce the measured basin. These values are model-dependent estimates, not direct material properties. Assumptions about layer thickness, Poisson’s ratio, contact stress, seasonal moisture, temperature, and layer bonding can materially affect the outcome. Test temperature is particularly important for asphalt, whose stiffness changes substantially with temperature and loading rate.
FWD surveys suit targeted investigations and rehabilitation design because they provide detailed structural information at selected stations. Limitations include lane closures or rolling traffic management, discrete test spacing, and the need for correct sensor seating and calibration.
Traffic-speed deflection devices
Traffic-speed deflection systems use non-contact sensors to measure pavement deflection while travelling at highway speed. They can screen extensive networks with limited disruption and identify locations where conventional FWD testing should be concentrated. This broad coverage is valuable for strategic asset management.
Interpretation must account for device-specific loading arrangements, sensor geometry, vehicle speed, repeatability, and environmental effects. Traffic-speed measurements are generally most useful as the screening stage of a tiered programme, followed by project-level FWD, coring, or test pits where decisions require greater certainty.
Ground-penetrating radar for layer geometry and hidden anomalies
Ground-penetrating radar (GPR) transmits electromagnetic pulses and records reflections caused by contrasts in dielectric properties. On roads, it is commonly used to estimate pavement-layer interfaces, detect thickness variability, locate void-like features, identify areas of elevated moisture, map buried utilities, and investigate possible stripping or loss of support where site conditions permit.
Air-coupled antenna systems can collect data at traffic speed and are useful for broad thickness mapping. Ground-coupled systems often offer finer near-surface resolution, although they require closer sensor contact and slower operation. Frequency selection involves a trade-off: higher frequencies improve resolution but reduce penetration, while lower frequencies investigate deeper at lower detail.
Radar response is affected by material contrast, moisture, conductive clays, salts, reinforcement, and antenna coupling. A weak or missing reflection may indicate a gradual transition rather than the absence of an interface. Converting travel time to thickness also requires an estimate of electromagnetic wave velocity, which should be calibrated against cores, known construction information, or selected exposures. The most defensible GPR output is usually a map of relative variability confirmed through targeted intrusive verification, rather than an unqualified claim of exact layer thickness throughout a site.
For rehabilitation investigations, GPR and deflection testing work well together. Radar can show where asphalt or bound-base thickness changes, while deflection testing indicates whether those changes coincide with reduced structural capacity. This evidence sequence supports the diagnostic logic used in innovative approaches to pavement rehabilitation, where repair extent should relate to the underlying failure mechanism rather than surface appearance alone.
Seismic methods for pavement foundations and adjacent ground
Seismic testing measures the travel of stress waves through pavement layers and ground. Because wave velocity is related to stiffness and density, seismic methods can help identify changes in foundation condition, depth to stiff strata, weak or loosened zones, and potentially problematic transitions at embankments, cuts, and structures.
Surface-wave methods
Multichannel analysis of surface waves and related methods use dispersive surface waves to develop shear-wave velocity profiles. These profiles are useful in geotechnical characterisation because shear-wave velocity relates to small-strain stiffness. Road applications include assessing formation variability, examining embankment zones, and investigating sites where seismic site response or ground stiffness is relevant.
Resolution depends on sensor spacing, source energy, frequency range, and the validity of the assumed layered-ground model. Near-surface pavement layers can complicate interpretation. Where design decisions depend on the findings, results should be reconciled with boreholes, penetration tests, or other site data.
Seismic refraction and reflection
Seismic refraction can map velocity changes associated with rockhead, dense layers, or broad ground transitions. Reflection methods may provide more detailed imaging in suitable conditions, though they require greater acquisition and processing effort. These techniques are most useful where pavement defects may be associated with larger geological features, void-prone ground, slope conditions, or deep drainage pathways rather than the pavement structure alone.
Electrical and electromagnetic techniques for moisture and void investigation
Electrical resistivity tomography (ERT) injects current into the ground and measures voltage differences to infer a resistivity distribution. It can assist in locating seepage zones, saturated fill, potential voids, buried channels, and changes in ground material. High conductivity may be associated with moisture or clay-rich soils, but the relationship is not unique: pore-water chemistry, temperature, and material composition also affect resistivity.
ERT is often used along road embankments, near culverts, at recurring wet spots, and where subsurface erosion is suspected. It is slower than traffic-speed pavement surveys and usually requires electrode access, so it is best suited to focused investigations. In wet pavement systems, the evidence should be considered with drainage inspections, groundwater observations, and seasonal conditions. A more complete treatment of foundation behavior is available in the discussion of soil stability in transport infrastructure.
Electromagnetic induction provides faster non-contact or near-surface screening of apparent conductivity. It can map relative differences in moisture or soil type across broader areas, although depth sensitivity is limited and readings may be affected by metallic utilities, fences, reinforcement, and nearby vehicles. Its main value lies in identifying patterns that warrant direct verification.
Methods for concrete pavements and structural interfaces
Concrete pavements call for several distinct NDT methods. Joint load-transfer efficiency can be estimated from deflections measured on both sides of a joint under controlled loading. Low transfer may indicate dowel deterioration, loss of aggregate interlock, widened joints, or inadequate support. Interpretation should also account for joint opening, temperature gradients, slab dimensions, and load position.
Impact echo, ultrasonic pulse velocity, and ultrasonic tomography can investigate delamination, cracking, voids beneath slabs, and internal concrete discontinuities. These methods rely on wave propagation and reflected signals, so coupling quality, reinforcement, aggregate type, slab thickness, and boundary conditions all affect the results. They are valuable for targeted diagnosis but are not generally suitable as stand-alone network-level methods.
Infrared thermography can reveal near-surface delamination or moisture-related thermal anomalies when environmental conditions create sufficient temperature contrast. Early-morning and late-day surveys may be useful, although the inspection window depends on weather. Thermal images should be treated as anomaly maps requiring correlation with sounding, cores, or other NDT evidence.
Designing a defensible NDT program
Effective NDT is organised as a staged investigation. The first stage compiles construction records, maintenance history, drainage layouts, traffic patterns, crash reports where surface defects are relevant, and previous condition surveys. The second collects broad, rapid measurements such as visual imagery, profiling, traffic-speed deflection, or air-coupled GPR. The third uses focused methods—FWD, ground-coupled radar, ERT, seismic arrays, coring, and test pits—to resolve anomalies that affect the engineering decision.
| Observed concern | Useful NDT combination | What requires confirmation |
|---|---|---|
| Repeated wheel-path cracking | Imaging, FWD, GPR | Layer condition, bonding, moisture, material properties |
| Localized settlement near drainage | Profiling, GPR, ERT, targeted seismic survey | Drain integrity, erosion, void geometry, soil condition |
| Variable pavement thickness | Air-coupled GPR, selected cores | Radar velocity assumptions and actual interfaces |
| Concrete slab rocking or faulting | FWD, joint testing, ultrasonic or impact methods | Support loss, dowel condition, slab defects |
Quality controls that affect interpretation
- Record environmental conditions. Pavement temperature, recent rainfall, frost condition, and seasonal groundwater levels influence measurements.
- Establish location control. All datasets need compatible chainage, lane references, and coordinate systems so anomalies can be compared accurately.
- Calibrate against intrusive observations. A limited number of cores, boreholes, or pits gives physical meaning to indirect signals.
- Document uncertainty. State depth resolution, detection limits, processing assumptions, and alternative explanations for every anomaly.
- Repeat critical surveys consistently. Comparable equipment settings, travel paths, and seasonal conditions improve interpretation of trends.
A useful final deliverable is more than a set of colour plots. It should define homogeneous pavement sections, rank anomalies by consequence and confidence, show the evidence behind each interpretation, and identify where verification is required. For instance, a section showing radar-indicated moisture, widening outer deflection bowls, and a nearby blocked outlet may be selected for drainage inspection and targeted exposure. The exposure then determines whether the cause is saturated support, erosion, a failed pipe, or another local defect.