A millimetre-scale settlement trend can matter more than an obvious surface defect when it affects a bridge approach, railway embankment, tunnel portal, or retaining structure. Remote sensing can reveal these trends along long corridors and in difficult terrain before they appear in routine visual inspections. It does not replace field investigation; it helps direct field teams to locations where movement, geometry, moisture, or thermal response suggests a developing problem.
In transport infrastructure, remote sensing involves collecting measurements without placing an inspector or instrument at every point on an asset. Satellites, aircraft, uncrewed aerial systems, mobile mapping platforms, and fixed sensors can provide evidence on ground movement, surface condition, vegetation, drainage patterns, and structural geometry. The data can support asset screening, condition assessment, construction verification, post-event reconnaissance, and maintenance prioritisation.
What remote sensing measures in infrastructure work
Remote sensing does not measure “condition” directly. It records physical responses—reflected radiation, radar backscatter, emitted thermal energy, elevation, or image texture—that require engineering interpretation. A dark area in an optical image may be wet pavement, a new asphalt overlay, shadow, or contamination. A radar-derived line-of-sight displacement may be associated with embankment settlement, structural movement, vegetation effects, or processing artefacts. Critical findings must be linked to a plausible deterioration mechanism and confirmed using ground-based methods.
| Method | Primary output | Typical infrastructure applications | Key constraint |
|---|---|---|---|
| Optical satellite and aerial imagery | Colour, texture, feature change | Corridor inventory, erosion, slope change, flood extent, surface defects | Cloud, shadow, resolution, and lighting conditions |
| LiDAR | Dense three-dimensional point cloud and terrain model | Clearance, slopes, drainage, deformation mapping, vegetation encroachment | Cost, occlusion, and repeat-survey consistency |
| Satellite radar interferometry | Surface displacement along satellite line of sight | Settlement screening, landslide surveillance, subsidence around structures | Coherence loss and displacement geometry |
| Thermal imaging | Surface temperature patterns | Moisture screening, delamination indications, drainage anomalies, electrical inspections | Strong dependence on time, weather, and material properties |
| Multispectral and hyperspectral imaging | Reflectance in selected wavelength bands | Vegetation stress, moisture patterns, material discrimination, environmental change | Interpretation requires calibration and suitable spectral resolution |
Platforms and their appropriate roles
Satellite observations: repeated regional screening
Satellite imagery is useful where networks are extensive or site access is constrained. Optical imagery can reveal altered river courses, newly exposed erosion scars, construction activity near rights-of-way, sediment deposition, slope disturbance, and major storm damage. Repeated acquisitions help distinguish persistent change from temporary conditions.
Synthetic aperture radar (SAR) can collect data through cloud cover and without daylight. Interferometric SAR, or InSAR, compares radar phase across multiple acquisitions to estimate displacement along the satellite viewing direction. Time-series analysis can identify slow, distributed ground movement over months or years. This makes it relevant to compressible soils beneath approaches, mining-related subsidence, unstable slopes, and ground movement near tunnels or cuttings.
InSAR results need careful interpretation. The measurement is not automatically vertical settlement: it combines vertical and horizontal movement projected onto the radar line of sight. Dense vegetation, water, rapid displacement, changing pavement surfaces, and snow can reduce coherence. Atmospheric delay and reference-point selection may also bias results. Treat a persistent displacement zone as a screening signal, then compare it with geology, drainage, construction history, level surveys, GNSS observations, crack mapping, and field evidence before assigning a cause.
Airborne and uncrewed surveys: detail where it matters
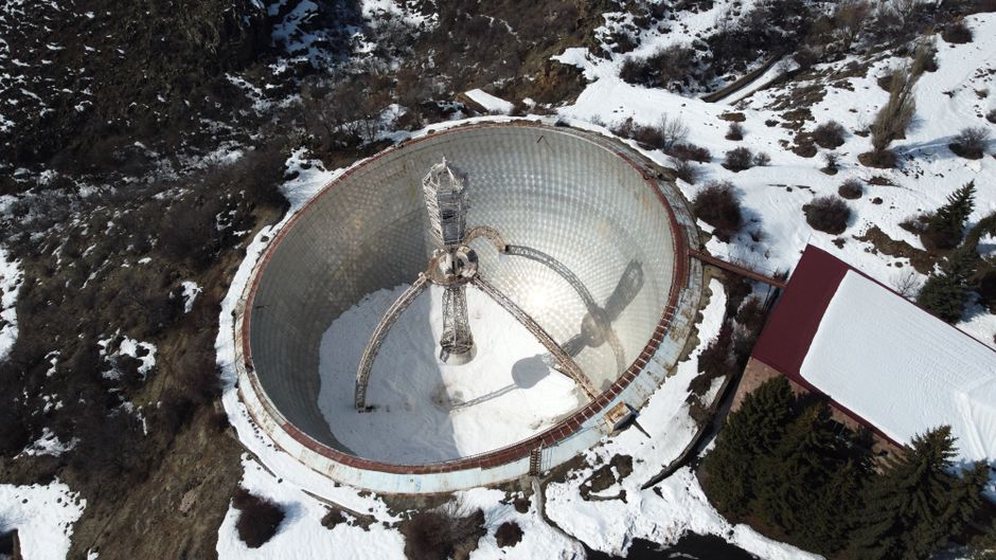
Manned aircraft and drones can collect higher-resolution imagery or LiDAR over selected assets. Their main advantage is targeted coverage: a slope after intense rainfall, a bridge deck before access equipment is mobilised, a rock cutting with difficult ground access, or a rail corridor requiring an accurate inventory of vegetation and drainage features. Flight planning can be matched to the required ground sampling distance, viewing geometry, and operational restrictions.
Photogrammetry reconstructs three-dimensional geometry from overlapping images. With stable camera calibration, adequate overlap, suitable lighting, and well-distributed ground control or independently verified checkpoints, it can produce orthomosaics and surface models for change detection. It is useful for mapping scarps, erosion gullies, exposed rock, surface cracking visible at the survey scale, stockpiles, and construction progress. Smooth, reflective, repetitive, and heavily shaded surfaces can be difficult to reconstruct reliably.
Airborne LiDAR emits laser pulses and records returns from surfaces. It can provide terrain data beneath partial vegetation cover and is well suited to catchment-scale drainage assessment, slope morphology, vegetation clearance, overhead line environments, and corridor-wide geometry. Repeat LiDAR surveys can identify elevation change, but detected differences must exceed the combined uncertainty associated with sensor calibration, georeferencing, surface classification, and registration. Small apparent changes should not be interpreted without an uncertainty threshold.
Mobile mapping and close-range sensing
Vehicle-mounted cameras, laser scanners, inertial systems, and GNSS receivers can capture road and rail corridors efficiently. They support clearance assessment, asset inventory, pavement surface imaging, tunnel lining documentation, and identification of roadside hazards. Their value lies in repeatable network-scale coverage, although positional accuracy can degrade in urban canyons, dense forests, and tunnels where satellite visibility is limited.
Close-range thermal cameras, ground-based laser scanners, and high-resolution imaging are most useful once a likely defect mechanism has been identified. They fill the gap between broad-area screening and hands-on inspection. A thermal anomaly on a bridge deck, for example, may justify chain dragging, impact-echo testing, moisture verification, or other appropriate non-destructive methods. It is not proof of delamination on its own.
Applications across transport assets
Earthworks, slopes, and foundations
Remote sensing is particularly valuable for geotechnical assets because deformation and water pathways are spatial processes. Terrain models can reveal slope breaks, old landslide morphology, blocked ditches, erosion channels, and changes in drainage connectivity that may be missed during road-level inspections. Radar time series can identify areas of gradual movement, while optical imagery may show fresh bare ground, cracking, sediment fans, or disturbed vegetation.
Engineering interpretation should combine observed change with the ground model: lithology, discontinuities, groundwater conditions, fill history, retaining measures, rainfall records, and loading. A pattern aligned with an embankment toe may indicate settlement or lateral spreading; one following a hillside contour may suggest slope creep. Neither conclusion is adequate without confirming movement direction, depth, rate, and triggering conditions.
For railways, relatively small differential movements can have operational consequences even when broad earthwork stability appears acceptable. Remote observations can identify sections requiring precise track geometry review, but they do not replace track measurements or investigation of ballast, formation, drainage, and subgrade behaviour. The relationship between remote observations and maintenance decisions is explored further in modern innovations in rail track maintenance.
Road surfaces and drainage corridors
High-resolution imagery can reveal visible cracking, patching, rut-related ponding, edge deterioration, shoulder erosion, and recurring wet areas. Automated image classification can speed up inventory creation, but its outputs should be checked against a representative labelled dataset. Shadows, road markings, seal treatments, and contamination may produce false detections.
Remote sensing is often more useful when pavement distress is assessed alongside drainage and ground conditions. A sequence of repairs below a hillside seepage zone may point to moisture-related weakening rather than traffic loading alone. LiDAR-derived flow paths can help identify blocked culverts, inadequate outlet gradients, and areas where concentrated runoff is likely to cause erosion. The resulting evidence should guide field checks of culvert condition, ditch performance, groundwater emergence, and pavement layer behaviour.
Bridges, retaining walls, and elevated structures
Drone imagery and photogrammetry can reduce inspector exposure when examining difficult-to-access components, including piers, bearings, expansion joints, deck edges, and high retaining walls. They create a repeatable visual record and can support defect mapping where image resolution and viewing angle are sufficient. Laser scanning can document clearance envelopes, member alignment, and accessible surface deformation.
These methods have clear limits. Hidden faces, bearing interiors, underside details, crack depth, corrosion loss beneath coatings, and internal deterioration may remain undetected. A photogrammetric model can improve visual access, but it cannot establish residual capacity. Engineering assessment still requires inspection access, measurements, material testing, understanding of load paths, and structural analysis where necessary. Broader issues of deterioration and assessment strategy are addressed in evaluating the safety of aging transport infrastructure.
Tunnels and portals
Satellite methods are unavailable inside tunnels. Mobile LiDAR, imaging, thermal inspection, and ground-based scanning can document lining geometry, water ingress zones, surface cracking, clearance constraints, and equipment interfaces. At tunnel portals, InSAR and LiDAR may assist with monitoring surrounding slopes and approach embankments. Repeated scans can identify geometry changes, but control targets and stable reference areas are essential because apparent movement may result from scanner registration error.
From imagery to defensible decisions
A remote sensing programme should begin with an asset decision, not a sensor purchase. The key questions are practical: which failure modes matter, what physical precursor can be observed, what coverage and revisit interval are needed, and what field action should follow an alert?
- Define the decision and risk context. Establish whether the work supports network screening, design baseline development, construction control, emergency response, or detailed asset diagnosis. Set consequence-based priorities for bridges, tunnels, cuttings, flood crossings, and critical routes.
- Choose measurable indicators. Examples include displacement rate, elevation change, drainage obstruction, vegetation encroachment, erosion extent, thermal contrast, and visible defect density. Each indicator should have a credible relationship to a condition mechanism.
- Select sensor, resolution, and revisit rate. Slow regional settlement may suit satellite time series. Rapid erosion after triggering rainfall may require drone imagery, while tunnel lining geometry may need close-range scanning.
- Establish control and data quality procedures. Record coordinate reference systems, vertical datums, calibration status, ground control, checkpoints, acquisition conditions, and processing settings. Repeat surveys need comparable methods if measured change is to be credible.
- Validate anomalies in the field. Use targeted inspection, survey, boreholes, piezometers, structural instrumentation, material testing, or drainage investigation according to the suspected mechanism.
- Integrate findings into asset records. Store raw data, processed products, uncertainty information, interpretation notes, inspection findings, and decisions together. A mapped anomaly without a traceable disposition offers little operational value.
Accuracy, uncertainty, and false confidence
The apparent precision of a digital map can exceed its actual accuracy. Orthomosaics may appear consistent while containing local positional shifts. A point cloud may contain millions of points yet still be unsuitable for detecting small deformation if registration is unstable. Machine-learning classifications can report high overall accuracy while missing rare, safety-critical defects that prompted the survey.
Quality assurance should report uncertainty in terms relevant to the task. For terrain-change studies, this includes horizontal and vertical accuracy, point density, vegetation-filtering performance, registration residuals, and minimum detectable change. For radar displacement, it includes coherence, temporal coverage, reference stability, atmospheric correction method, and projection geometry. For image-based defect detection, it includes detection rate, false-alarm rate, class definitions, lighting conditions, and independent validation data.
False positives consume inspection resources, while false negatives can leave hazards unidentified. Thresholds should therefore reflect risk rather than software confidence alone. A low-confidence anomaly at a high-consequence bridge approach may warrant prompt inspection, whereas a stronger signal on a stable, low-consequence access road may be scheduled for routine verification.
Operational and governance considerations
Remote sensing introduces practical controls beyond measurement quality. Drone missions require airspace, site safety, weather, and line-of-sight planning. Railway and highway surveys need traffic protection and coordination with operators. Imaging can capture adjacent property, people, or sensitive facilities, creating privacy and data-governance obligations. Cybersecurity also matters when sensor networks, cloud processing, and asset management systems exchange location and condition data.
Long-term programmes benefit from a documented baseline. It should record acquisition dates, sensor configuration, coordinate system, control methodology, surface conditions, and known changes such as resurfacing, earthworks, vegetation clearance, or drainage repairs. Without this context, a later difference map may confuse maintenance work with deterioration.
When a displacement hotspot is detected, the field task should define a measurable confirmation. Survey stable reference monuments and the crest, toe, and pavement edge along defined cross-sections; inspect drains and outlets; then compare the measured profile with the remotely sensed trend and its stated uncertainty. This links wide-area detection to an engineering observation that can support an informed decision.